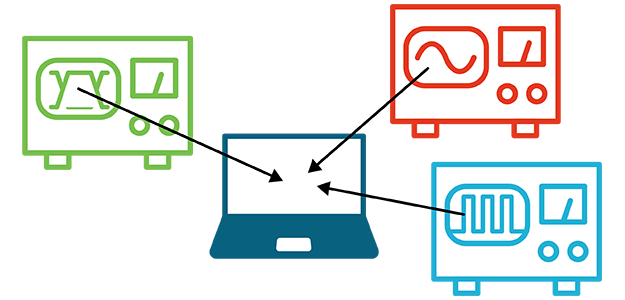
Most bench oscilloscopes have many built-in features that allow you to do a lot of analysis and operations on the instrument itself. But sometimes, there is a need to do some offline analysis.
So, this article talks about why offline analysis is necessary and how to use offline analysis software.
Why offline analysis is worth considering
Here are some reasons why you might sometimes want to (or need to) do offline analysis.
Work in your own time

Oscilloscopes are often shared between several engineers in a lab, making the time spent on a scope precious. Here, offline analysis enables you to take the measurements using the oscilloscope, grab the data and bring it back to your desk to work on it in your own time rather than taking up valuable extra time on the oscilloscope. Besides, offline analysis enables partial remote work as you can go into the lab, get the data you need, and do the analysis at home.
Compare measurement results with simulated data
We spend a lot of time simulating the data and circuits even before we manufacture any device. So, you can bring back all the data from testing the device and do your offline analysis at the same terminal you used to do the simulation, which will enable you to compare the results of your measurement with those of the simulations.
Save the hassle of crowded or wrong screenshots

We traditionally build reports by taking individual screenshots of the data on the oscilloscope and utilizing them using Excel and Word. However, sometimes, the screenshot might be too crowded with annotations, or it might not have the information you wish to analyze. With offline analysis, raw data from the oscilloscope is shared with the offline analysis software, so you can analyze whatever you want directly from that data. Gathering raw data from the oscilloscope reduces the think ahead about exactly what measurement or view you have to gather during your limited time in front of the instrument.
Examine data using a oscilloscope-familiar environment
The problem with analyzing oscilloscope data is that usually, you need to export the data from the oscilloscope as a CSV file, open it in Excel, and then manipulate it and put it into a graph. Since we're not necessarily Excel experts, this can be hard. Offline analysis makes your job easier by allowing you to import the data directly into an offline analysis tool that looks and feels like the oscilloscope you are already familiar with and examine it in the same way you would do in the oscilloscope.
Increase the functionality of legacy oscilloscopes
Offline analysis software can work with data from any oscilloscope, even those that are 10-15 years old. All you need to do is take the data from a oscilloscope and transfer it into the offline analysis software via a USB stick. With some of Tektronix's newer oscilloscopes like the TBS1000C or TBS2000B, you can even directly connect the oscilloscope to the offline analysis package and import the data directly into the software. So offline analysis software also essentially increases the functionality of legacy oscilloscopes that have limited capabilities.
How to Use Offline Analysis Software
Here's an overview of the things you can do with offline analysis software and how to get the best results using TekScope PC analysis software:
Gathering data from the oscilloscope

You can connect the software to the oscilloscope directly or transfer the data from the oscilloscope to the software using a USB stick. Using this software, you can adjust the horizontal and vertical scales, as well as the trigger to get the data scaled appropriately before you gather the samples for further analysis. Once you have the data, you can use the offline analysis software to zoom in further, see more details in the measurements, change the scales, and more. You can also highlight some measurements, show cursors, and add specific measurements. Once you examine and analyze the data as you wish, you can send a report with all this analysis as opposed to only the initial raw data.
Making measurements
One of the enhanced features of the offline analysis tool is called measurements. This feature allows you to add additional automated measurements to the signal like frequency measurement, amplitude measurement, RMS measurement, and more. In addition, you can change the way measurements such as rms are made. For example, you can measure the rms value of the entire waveform or measure the rms value of each cycle within the waveform. You can also add a trend line to the signal, which shows the different RMS values of each cycle. All this gives you much greater insight than a simple screenshot of the data.
Decoding the data

The offline analysis tool can provide further insight into your data by providing the ability to decode some of the most popular serial buses, including I2C, SPI and RS232. Simply select which bus you want to decode, assign individual changes to the appropriate bus control lines and view the decoded data. As well as being able to see the decoded data alongside the captured signals, you can view the decoded data in a table format that can then be exported to a CSV file for further analysis. If you have very long records, you can use the Search feature to find different types of decoded data includes specific addresses or data and error events such as a missing acknowledgment.
Sharing the data
The best part about this is that you can easily share all this data. After analyzing the data and adding any necessary measurements or decodes, you can export the data the data to a CSV file or as an image, that can be later brought into a report and conveniently emailed to your colleagues.
TekScope PC Analysis Software
The base version of the TekScope software covers everything that has been described in this article including zooming, annotating, showing measurements with statistics, decoding, searching, and generating reports as well as direct connection to a TBS1000C or TBS2000B oscilloscope. It also has multi-language support for ten languages, which allows you to show the whole software in your local language. This is available either as a one-year license or as a perpetual license and can be installed on up to two PCs.
Summary
To summarize, offline analysis might be useful for a variety of reasons, including that it enables you to analyze your data anytime, anywhere and share this data easily in the form of a report. It also provides enhanced data collection, analysis, and measurement capabilities.
To learn more about the TekScope oscilloscope software, visit the Tektronix website.
To get started right away, register for a TekScope license.