Debugging embedded systems often involves looking for clues that are hard to discover just by looking at one domain at a time. The ability to look at time and frequency domains simultaneously can offer important insights. Mixed-domain analysis is especially useful for answering questions such as:
- What’s going on with my power rail voltage when I’m transmitting wireless data?
- Where are the emissions coming from every time I access memory?
- How long does it take for my PLL to stabilize after power-on?
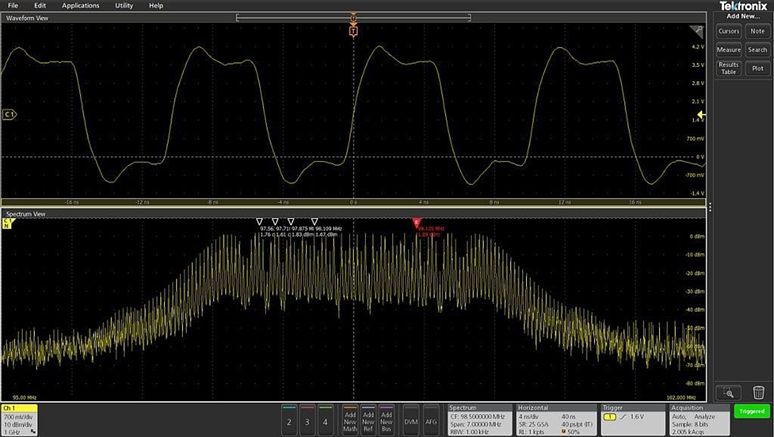
Mixed-domain analysis can help answer questions like these by providing views of time domain waveforms and frequency domain spectra in a synchronized view. Up until recently, the Tektronix MDO4000C Mixed Domain Oscilloscope has been the only oscilloscope to offer synchronized time and frequency domain analysis with independent control over waveform and spectrum views.
Today the 4, 5 and 6 Series MSO Mixed Signal Oscilloscopes offer an analysis tool to address this need called Spectrum View. It is a standard feature in the 4, 5 and 6 Series MSOs and delivers several key capabilities:
- Enables the use of familiar spectrum analysis controls (Center Frequency, Span and RBW)
- Allows optimization of both time domain and frequency domain displays independently
- Enables a signal to be viewed in both a waveform view and a spectrum view without splitting the signal into different inputs
- Enables accurate correlation of time domain events and frequency domain measurements (and vice versa)
- Significantly improves achievable frequency resolution in the frequency domain compared to an FFT
Spectrum View uses patented hardware built into the instruments. To understand how it works, it is important to note that digital oscilloscopes generally run their analog-to-digital converters (ADC) at the maximum sample rate. The stream of ADC samples is then sent to a decimator that keeps every Nth sample. At the fastest sweep speeds, all samples are kept. At slower sweep speeds, it’s assumed the user is looking at slower signals and a fraction of the ADC samples are kept. In short, the purpose of the decimator is to keep the record length as small as possible while still providing adequate sample rate to view signals of interest in the time domain.
In the 4, 5 and 6 Series MSOs, behind each FlexChannel® input is a 12-bit ADC inside a custom ASIC. The ADC sends high-speed digitized data down two paths. One path leads to hardware decimators which determine the rate at which time domain samples are stored. The second path leads to digital down converters also implemented in hardware. This approach enables independent control of the time domain and frequency domain acquisitions, allowing optimization of both waveform and spectrum views of a given signal. It also makes much more efficient use of the long but finite record length available in these instruments.
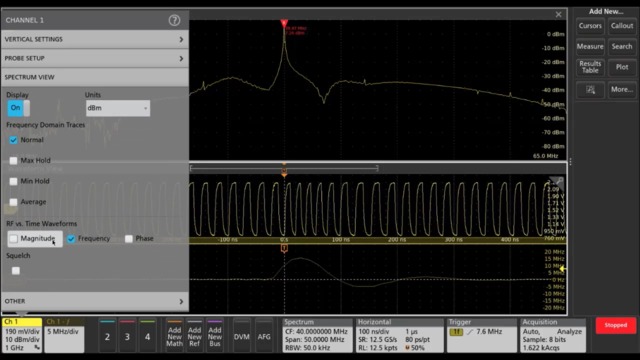
The underlying IQ data that’s used to create the spectrums shown by Spectrum View can also be used to calculate RF vs. Time waveforms that show how various characteristics of the RF waveform vary over the entire acquisition, not just where Spectrum Time is positioned. Three types of waveforms are available:
- Magnitude – The instantaneous magnitude of the spectrum vs. time
- Frequency – The instantaneous frequency of the spectrum relative to the center frequency vs. time
- Phase – The instantaneous phase of the spectrum relative to the center frequency vs. time
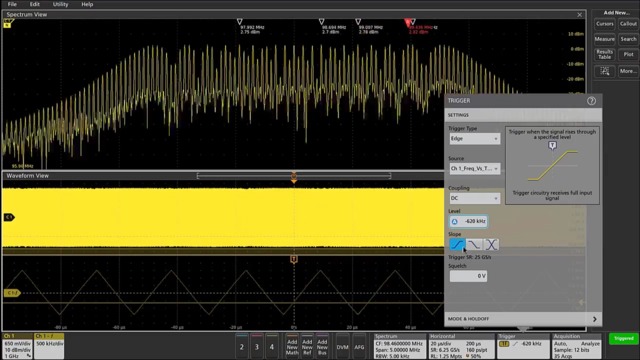
Each of these traces can be turned on and off independently, and all three can be displayed simultaneously. You can also trigger on these waveforms using an RF vs Time Trigger function.
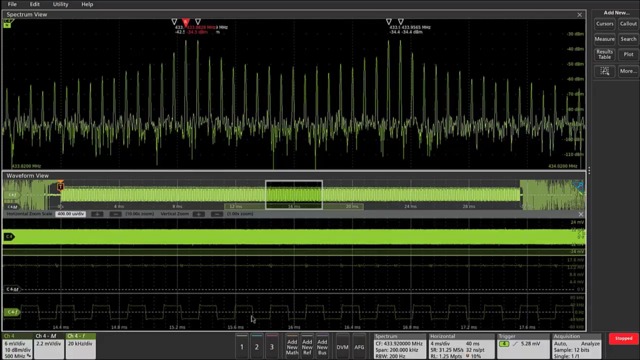
Here are three videos that demonstrate a low amplitude RF emission analysis, a spread spectrum clock analysis, and RF vs Time triggering for capturing a clock frequency glitch.
This video focuses on the low amplitude RF emission from a car’s key fob using the Magnitude vs Time and Frequency vs Time triggers.
Here, you can see how an edge trigger on the RF Frequency Deviation vs Time trace isolates and captures a short duration transient in the frequency of a clock signal
This last video shows how to stabilize a hardware trigger on the up-down chirp pattern of a spread spectrum clock using a Frequency Deviation vs. Time trigger.
For more information, download the application note – Spectrum View: A New Approach to Frequency Domain Analysis on Oscilloscopes.